Line Optimizer
Know where you are performing and where you need to improve
Ideal for plants that want to benchmark to understand where they are exerting excess forces that could damage containers or cause defects as well as customers that want to proactively monitor their lines to avoid costly slowdowns or critical damage defects.
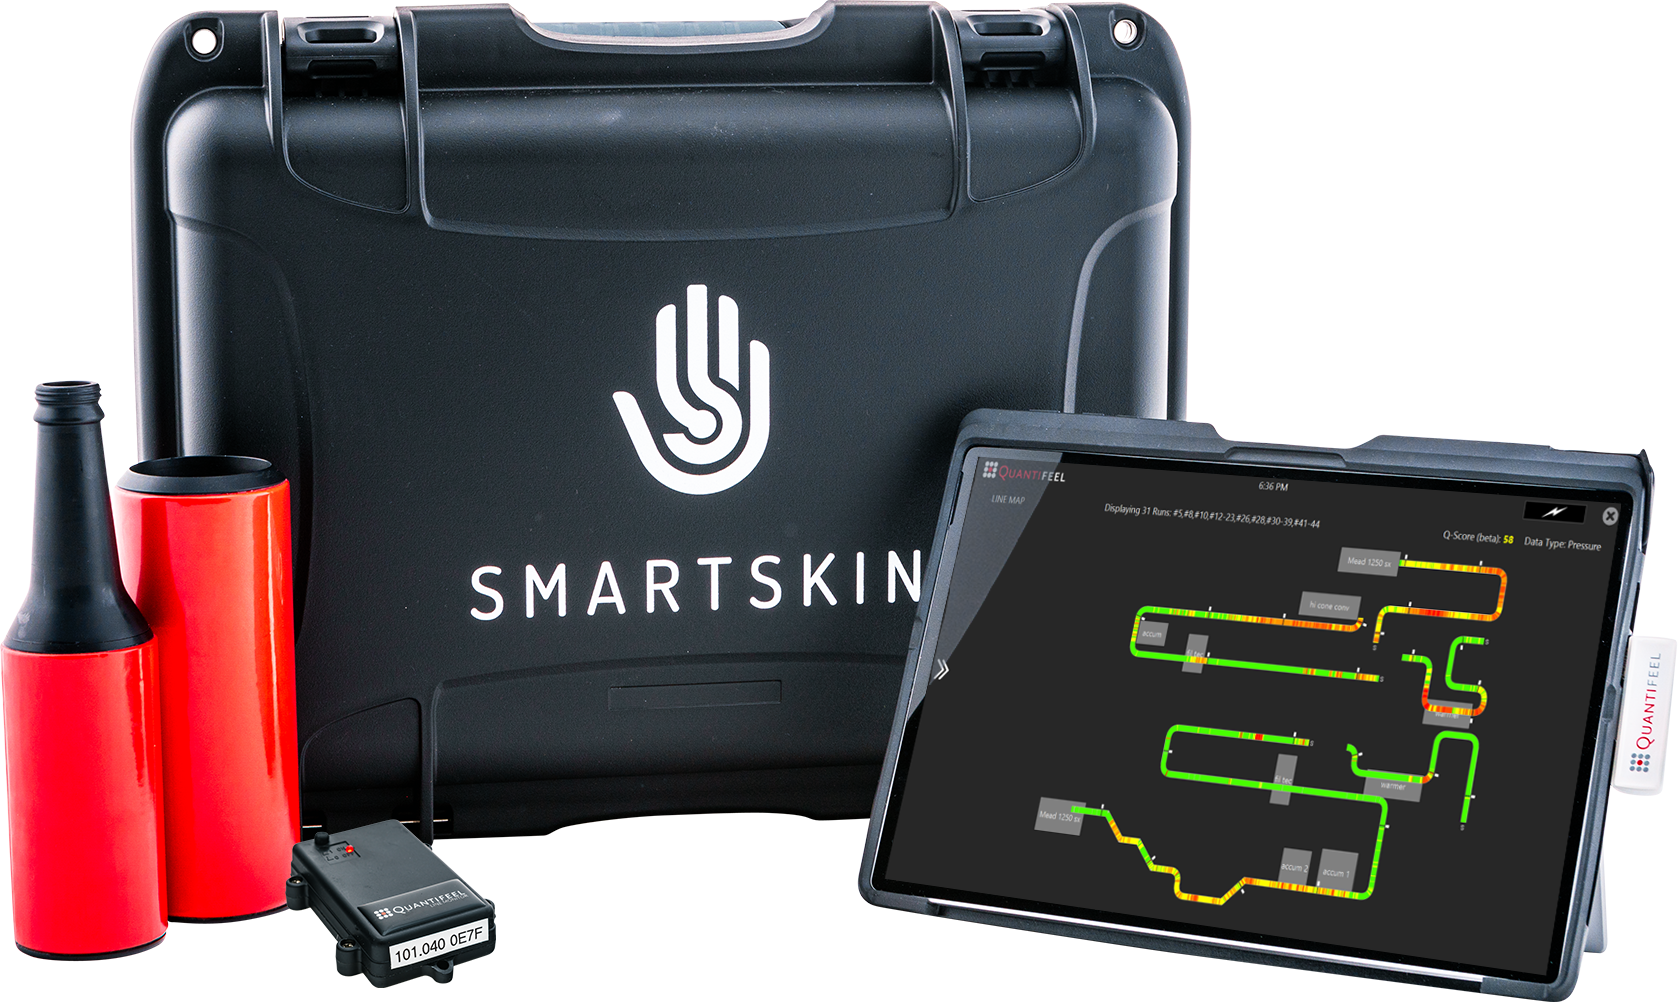
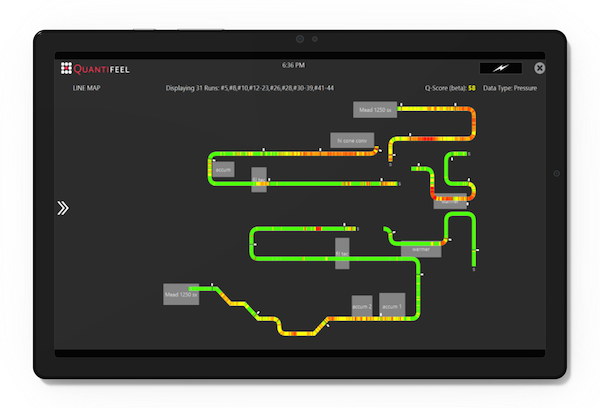
Line Optimizer builds upon the power of SmartSkin Diagnostic solution by adding the ability to visualize your entire line through a custom line map configuration in SmartSkin’s QuantifeelTM software. View trends and benchmark hotspots without stopping or slowing your production line.
Simply insert your SmartSkin drone into your line without stopping or slowing production, QuantifeelTM Optimizer with give you a visual representation of your complete line highlighting the areas experiencing adverse forces. Capture, keep and compare data from the beginning of your project to the end.

Showing you what is most statistically
relevant, so you can ignore the rest.

SmartSkin’s Line Optimizer uses our patented SmartSkin Drone sensing
technology, combined with SmartSkin Tag bluetooth tracking devices.
The two sensors work in tandem to collect data such as pressure
applied, shock from impact, spin, tilt, and scuffing, and communicate
to Quantifeel software exactly where on you line any adverse forces
occurred.
Quantifeel Optimizer brings your data to life in a visual map,
highlighting in green, yellow, orange in red, exactly where on the line
adverse forces occurred. You can select any area, and have instant
access to the exact amount of force that was applied, and pinpoint where
on the drone this force occurred.
FAQ’s
Map. Trend. Optimize.
Tracking and visualizing production line trends, and pinpointing areas of improvement, can be a daunting challenge. Many software solutions are overly complex, generating reports that are difficult to compare. In many cases, analysis is outsourced to consultants, leading to a lack of knowledge transfer.
SmartSkin changes the game by providing your team with a reliable, accurate, and user-friendly tool. Our line mapping feature allows you to quickly identify hotspots on your production line and track changes over time. With SmartSkin, you can say goodbye to frustrating software and hello to streamlined operations.
Features & benefits
Line Mapping
The Line Optimizer autonomously maps the entire production line, including machines, equipment, and critical process points. It creates a visual representation of the line layout, allowing operators and management to have a comprehensive view of the entire setup.
Simple Color Codes
Line Optimizer employs intuitive color codes to indicate the health status of different sections or parameters. Green signals normal operation within acceptable thresholds, while red highlights hotspots with deviations that require attention.
Immediate Hotspot Detection
By continuously monitoring real-time data from sensors and other data sources, the Line Optimizer can swiftly identify and flag hotspots where critical parameters are outside the desired ranges.
Root Cause Analysis
When a hotspot is detected, SmartSkin’s Quantifeel Software allows you to delve deeper into the data to conduct root cause analysis. This capability helps identify the underlying reasons for the deviations, such as equipment issues, process inefficiencies, or variations in raw materials.
Predictive Maintenance
Line Optimizer’s ability to detect hotspots and potential issues in advance enables facilities to implement predictive maintenance strategies. This approach helps prevent unexpected equipment failures and reduces downtime, optimizing overall production efficiency.
Planned Shutdowns
By identifying hotspots early on, the facility can plan and schedule necessary maintenance and adjustments during planned shutdowns, minimizing disruption to production.
Lean Manufacturing
Armed with the Line Optimizer’s insights, the facility can embrace lean manufacturing principles and continuously improve processes, leading to enhanced productivity and reduced waste.
Comprehensive Reporting
The tool generates comprehensive reports and performance metrics, making it easy to monitor and communicate the production line’s performance to stakeholders and regulatory bodies.
Industry Standards Comparison
Line Optimizer can benchmark the facility’s performance against industry standards, best practices, or previous production periods. This provides valuable insights for setting realistic performance goals.
Data-Driven Decision Making:
The tool’s real-time data analytics and visualization capabilities empower operators and management to make informed decisions quickly. They can identify trends, patterns, and opportunities for process optimization.
Intuitive Design
The Line Optimizer is designed with a user-friendly interface that is easy to navigate and understand, making it accessible to operators and management at all levels of expertise.
SmartSkin Drones
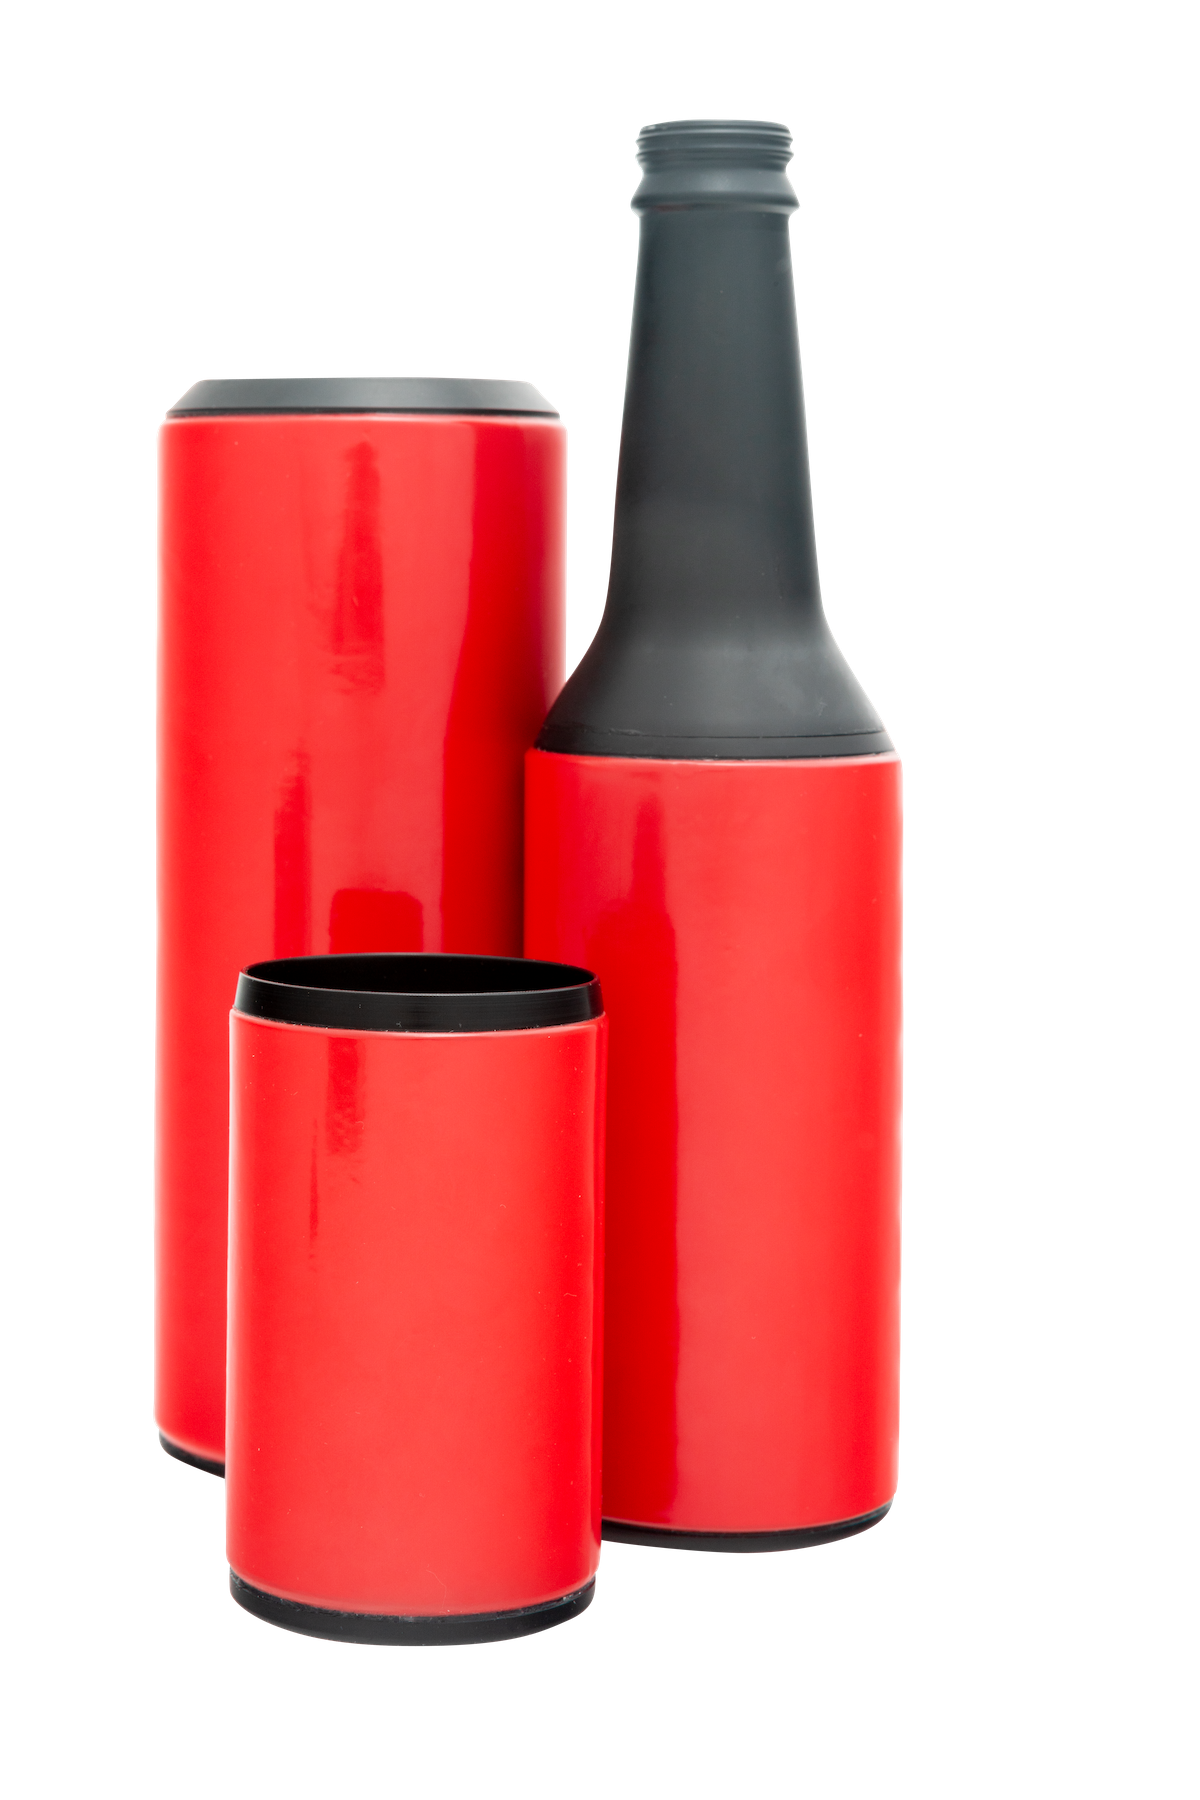
Purpose built to your containers specifications.
SmartSkin Drones can run in line with your product without interrupting production or requiring downtime.
Depending on your area of concern or validation following a change over or machine overhaul, SmartSkin drones can provide actionable insights from every part of the production line.
SmartSkin Drones are available in multiple sizes and formats that meet the specifications of your product.

QuantifeelTM Analyzer
Bringing your data to life.

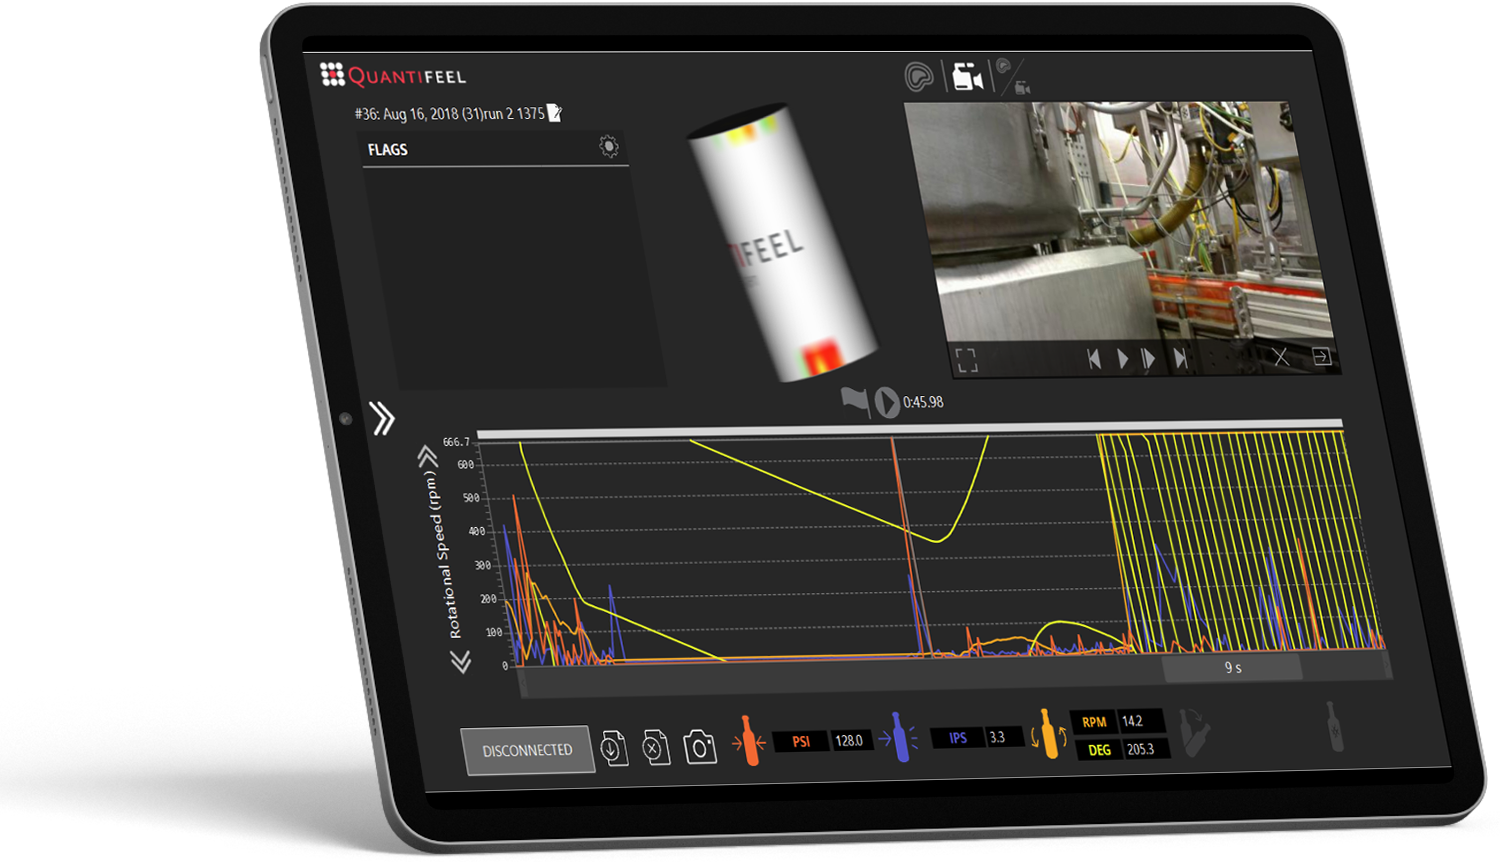
The QuantifeelTM Analyzer software is launched from a tablet and runs in conjunction with your SmartSkin Drone as it traverses the line.
QuantifeelTM uses a specialized algorithm to analyze 1000’s of data points and hone in on the exact moment that (within fractions of a second) that adverse forces occurred. The video capture element provides visual validation of the location giving your team a specific location to focus their efforts on. Once adjustments have been made, simply run you SmartSkin Drone again to validate that adverse forces have been eliminated.

